Fresche Solutions

X-Analysis View

Move RPG and COBOL Projects Forward Faster

How well do you know your RPG and COBOL applications?

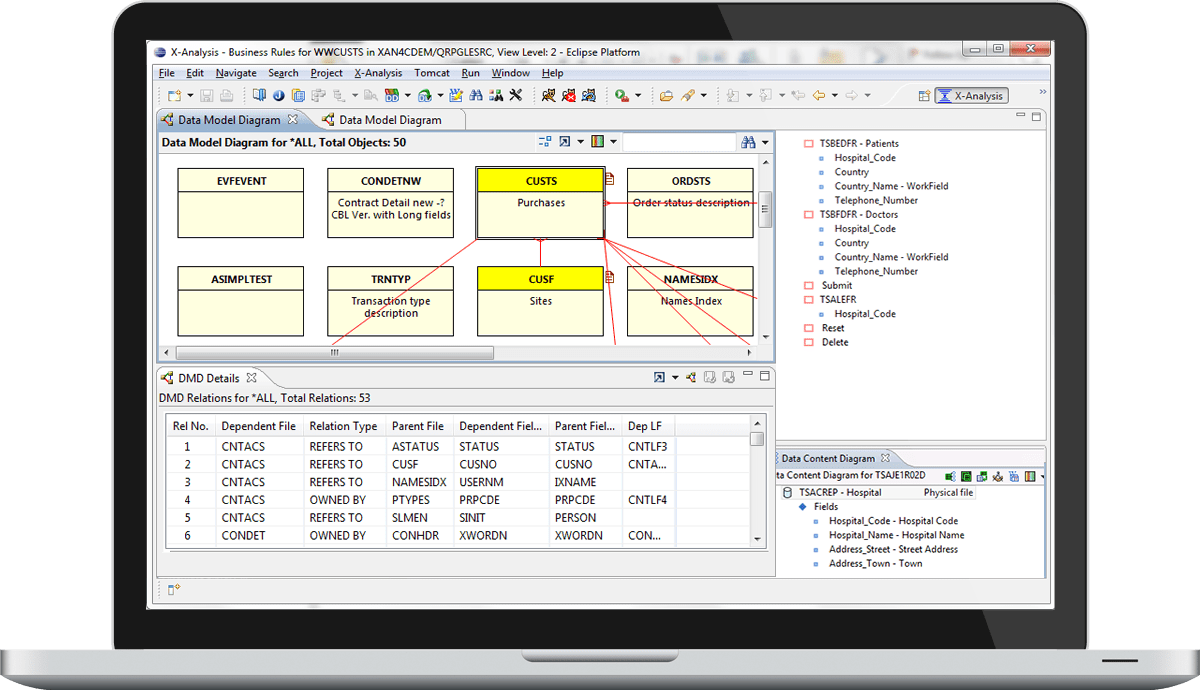
Understanding your code, data model and the impact of changes to the system can be difficult. With X-Analysis View, you can automatically generate interactive graphical documentation – charts and graphs that provide a 360-degree view into your RPG and COBOL applications. Gain insight into your application and data and significantly reduce the time and effort required to modify, maintain and test IBM i applications. This way, you’ll meet your business needs faster.

X-Analysis View helps speed up IBM i development

With X-Analysis View, you’ll be able to understand the impact of code changes across all your applications and make those changes with confidence. This results in better development, faster testing and greatly reduced risk. X-Analysis View shows you where to focus testing efforts so you can move projects forward quickly. It also allows you to onboard new developers faster as they can quickly navigate applications by seeing a high-level graphical view of them.
X-DB Modernize - Data model Diagram

A Glimpse of X-Analysis View

Speed Up Development and Reduce Maintenance

Play Video

How X-Analysis View Can Help You:

Understand code changes

Confidently make large, complex code changes to your IBM i applications. Understand the impact across all your applications and data sources.

Improve effort estimation

Gain in-depth detail about the cascading effects of change throughout your environment, and know where to focus testing efforts. See which objects would be impacted by a change.

Easily visualize applications

Automated graphical documentation and data flow diagrams let you display RPG as pseudo code, view the call stack, and quickly find information about object use, access and parameters.

Drill-down with precision

View detail right down to the source code, trace variables through multiple layers, and browse from anywhere. Quickly gain a complete understanding of your applications.

View “where used” information

Track “where used” information throughout the entire application or database. Track variables through all iterations and associations, highlight every object affected by a change.

Visualize relational data models

Get a deeper understanding of your business with relational data models of your IBM i application databases. Automatically extract the data models from DDS, DB objects and other sources.

Key Technical Features

  • Automated relational data modeling.
  • Drill-downs all the way to the source code.
  • Where used functions for impact analysis.
  • Automated graphical documentation.
  • Visual data flow diagrams.
  • Detailed system information suitable for audits.

Some of Our X-Analysis Clients

cross